Basin A
North Sea
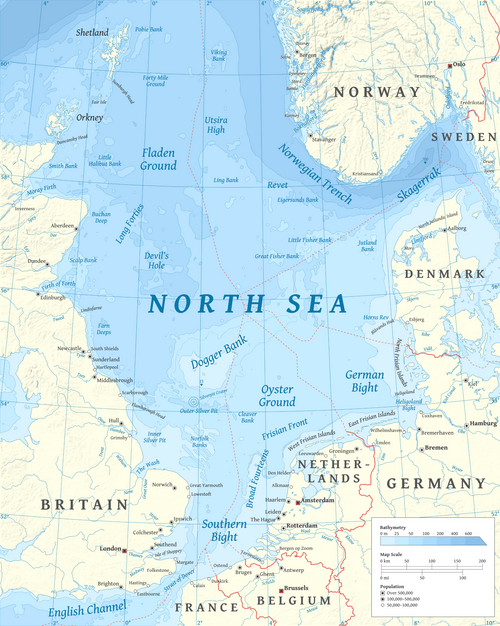
Open shelf sea, directly connected to the Atlantic Ocean. One of the most intensively used sea basins in the world; Rotterdam accounts for ≈12% of EU seaborne trade.
Basin B
Baltic Sea
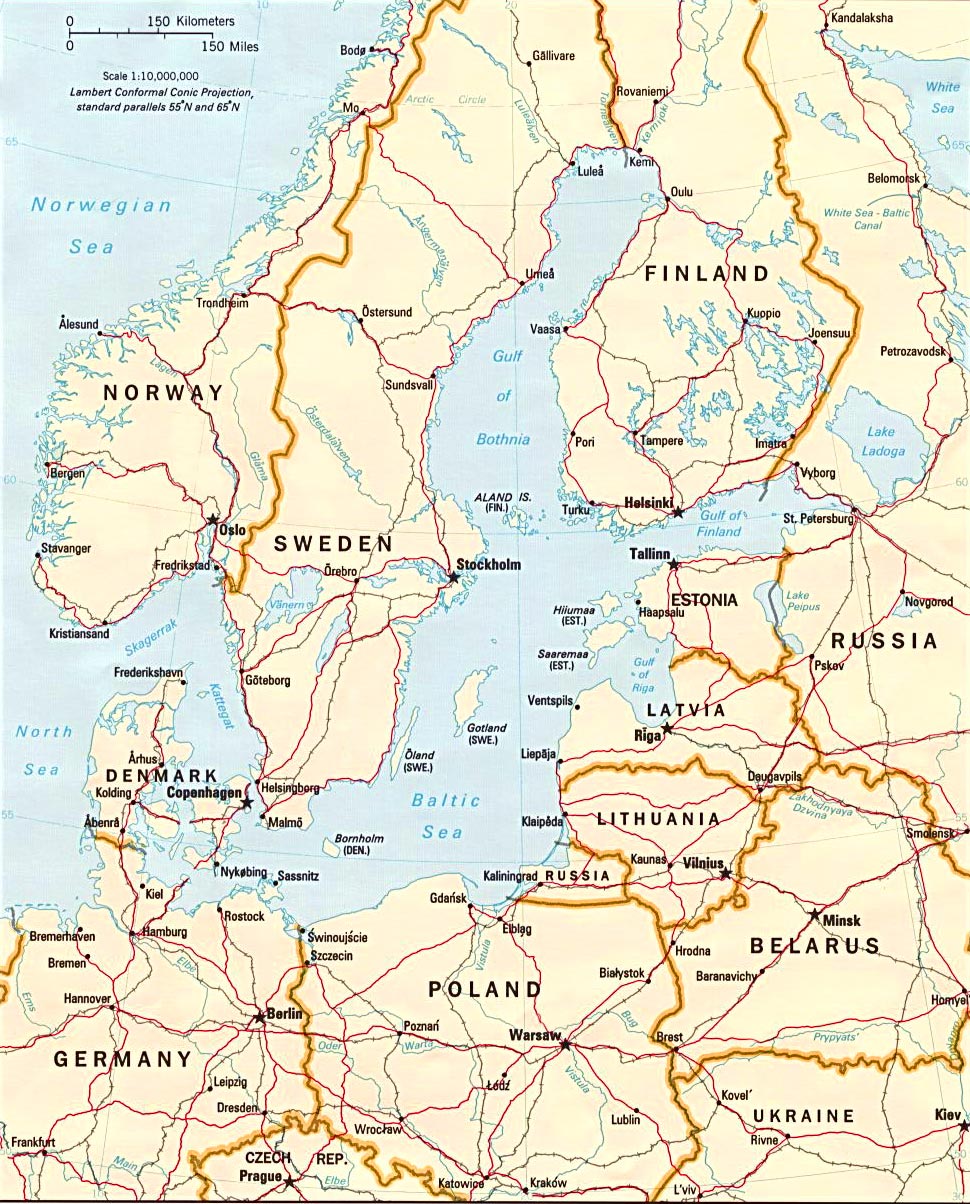
Semi-enclosed basin, shallower and ecologically more sensitive. Core area of the NB8 and HELCOM — meso-regionally aligned on security, ecology and energy.
Facts · Head-to-head
North Sea vs Baltic Sea
Direct comparison of physical and governance facts. Bar lengths are proportional — the sea with the higher value fills the bar completely, the other is scaled relative to it.
Basin A
North Sea
Open shelf sea · deep · intensively used · fragmented governance (~250 bodies).
575k
km² area
95 m
avg. depth
300 GW
wind 2050
Basin B
Baltic Sea
Semi-enclosed brackish basin · shallow · ecologically sensitive · integrated NB8/HELCOM governance.
377k
km² area
55 m
avg. depth
93 GW
wind 2050
Bars = relative · figures = absolute
Surface area
km²
Total surface area of the sea basin
Water mass
km³
Total water volume
Average depth
m
The Baltic is a shallow shelf sea → more vulnerable for subsea infra
Maximum depth
m
Norwegian Trench vs. Landsort Deep
Salinity
‰
The Baltic is brackish due to river inflow and limited exchange
Water renewal
years
How long it takes for the entire water volume to be renewed
Share as MPA
% NL part
Only 0.3% of the North Sea fully protected from bottom fishing
Offshore wind 2050
GW
EU/NL plans for installed capacity in 2050
Key figures from the report
At a glance
Shadow-fleet passages NL
North Sea
>1,300
Baltic Sea
Main route
in 2023–2024 along the NL coast
Ageing tankers
North Sea
≈72%
Baltic Sea
≈72%
ship-to-ship transfers, often uninsured
MPA Dutch North Sea
North Sea
≈26%
Baltic Sea
HELCOM coord.
Natura 2000 — 0.3% fully protected
Offshore wind 2050
North Sea
300 GW
Baltic Sea
Bornholm 3 GW
EU/NL plans vs. DK-DE energy island
Spatial footprint 2050
North Sea
≈26%
Baltic Sea
BEMIP MSP
of NL North Sea for offshore infra
Rotterdam share EU
North Sea
11.8%
Baltic Sea
—
tonnage EU seaports 2024 (Eurostat)
Synthesis
What the North Sea can learn from the Baltic
The report finds that the North Sea and Baltic Sea differ in geography and ecological profile, but that both regions face the same three pressures: hybrid threats, pressure on subsea assets, and intensifying spatial competition. The NB8 states have developed concrete answers to these.
The decisive difference lies in governance: HELCOM, BEMIP and NB8 formats act faster and more coherently than the fragmented North Sea architecture (~250 bodies). For the Netherlands the lessons sit in four areas — monitoring & control, ecology, critical subsea infrastructure and the offshore energy transition.
Source · Securing a Sustainable North Sea — Lessons from the Nordic-Baltic 8, draft 2026